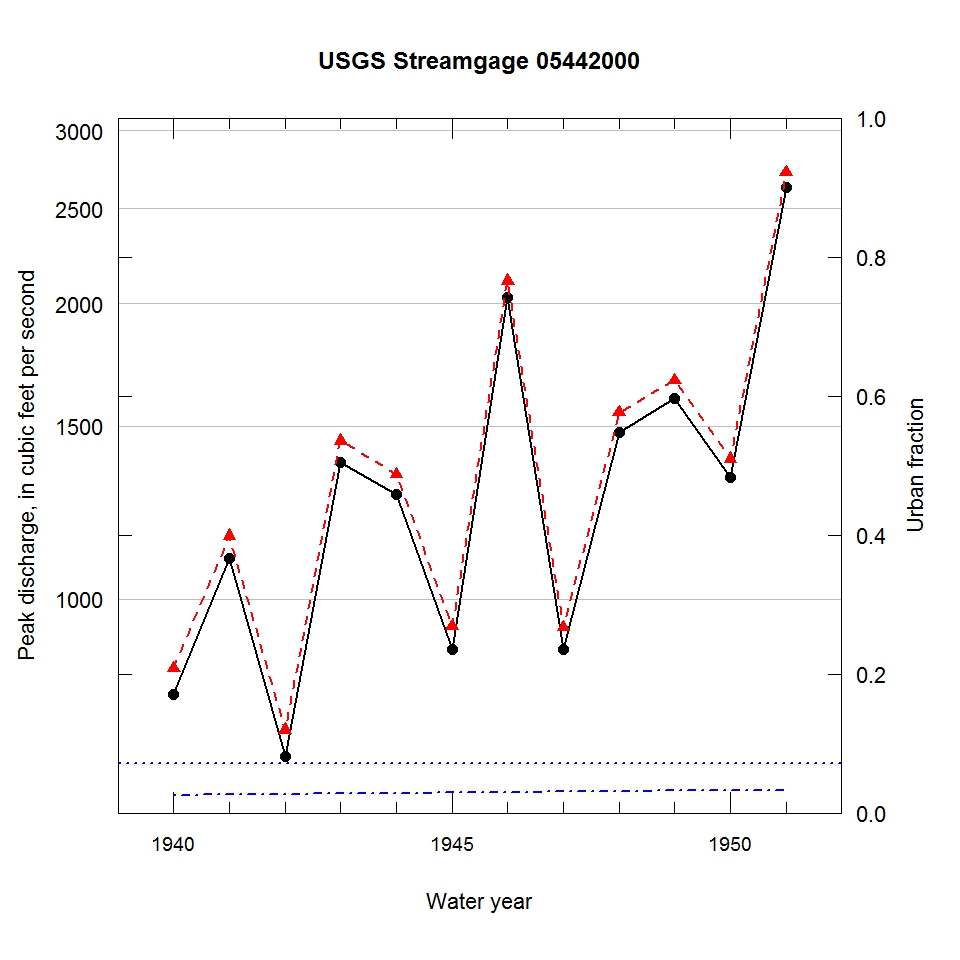
Observed and urbanization-adjusted annual maximum peak discharge and associated urban fraction and precipitation values at USGS streamgage:
05442000 KYTE RIVER NEAR FLAGG CENTER, IL


| Water year | Segment | Discharge code | Cumulative reservoir storage (acre-feet) | Urban fraction | Precipitation (inches) | Observed peak discharge (ft3/s) | Adjusted peak discharge (ft3/s) | Exceedance probability |
| 1940 | 1 | 2 | 440 | 0.026 | 0.796 | 800 | 850 | 0.780 |
| 1941 | 1 | -- | 440 | 0.026 | 0.755 | 1100 | 1160 | 0.622 |
| 1942 | 1 | -- | 440 | 0.027 | 1.309 | 692 | 736 | 0.832 |
| 1943 | 1 | -- | 440 | 0.028 | 1.119 | 1380 | 1450 | 0.461 |
| 1944 | 1 | -- | 440 | 0.028 | 1.717 | 1280 | 1340 | 0.516 |
| 1945 | 1 | -- | 440 | 0.029 | 1.983 | 889 | 938 | 0.738 |
| 1946 | 1 | -- | 440 | 0.030 | 0.652 | 2030 | 2110 | 0.217 |
| 1947 | 1 | -- | 440 | 0.030 | 1.278 | 889 | 936 | 0.739 |
| 1948 | 1 | -- | 440 | 0.031 | 1.834 | 1480 | 1550 | 0.414 |
| 1949 | 1 | -- | 440 | 0.032 | 0.002 | 1600 | 1670 | 0.365 |
| 1950 | 1 | -- | 440 | 0.033 | 0.143 | 1330 | 1390 | 0.491 |
| 1951 | 1 | D | 440 | 0.033 | 0.575 | 2630 | 2720 | 0.107 |

